

In this article, I’m sharing 50+ identity theft and credit card statistics (updated for 2022!).
There were 4.8 million identity theft and credit card fraud reports to the Federal Trade Commission (FTC) in 2020, resulting in a $4.5 Billion total loss.
This was a 45% increase in the number of cases and money lost in 2019.
Who are all these victims, where do they live, and just what types of crimes are committed against them?
Are the criminals getting smarter and savvier, or did the pandemic have something to do with it?
If you want to learn the answers, this article is for you!
Key Takeaways
-
Identity theft surged 53% in 2020, driven largely by pandemic-related scams targeting government benefits and online activity.
-
The average loss per victim was $800, but seniors lost more, averaging $1,100 per incident.
-
Cybercrime hit all ages and income levels, with 155.8 million Americans affected by data breaches and 791,790 internet fraud complaints filed that year.
Top Identity Theft and Credit Card Fraud Stats for 2022 (Editor’s Picks)
Here are the top ten statistics that stood out from the various reports and studies:
- There were nearly 1.4 million reported cases of identity theft in 2020, with nearly one-third of those having been victims of identity theft before
- Identity theft increased 53% from 2019 to 2020
- Married women are the most common victims of identity theft
- Identity thieves used other people’s information to defraud state and federal government agencies out of an estimated $200-$500 billion last year.
- 2020 identity theft was not typical. It struck the 30-39-year-old age group the most. In a normal year, thieves tend to target young adults and seniors more.
- There were nearly 400,000 cases of credit card fraud in the US last year.
- “Card not present” fraud is one of the leading forms of credit card fraud and is on the rise.
- Credit card fraud increased by nearly one-third in 2020, over 2019’s reported 270,000 cases.
- The US accounts for nearly one-third of the world’s credit card fraud cases, totaling $11 billion in losses in 2020 alone.
- Data breaches affected 155.8 million Americans last year, with victims ranging from ordinary consumers to the US Marshals Service.
Identity Theft Cases In The United States
The FTC took nearly 1.4 million reports of identity theft last year. The Identity Theft Resource Center (ITRC) reports that 29% of victims were repeat victims, having had issues with identity theft before. While it’s impossible to avoid being a target completely, one of the easiest ways to protect yourself is to freeze your credit.
How Many Americans Are Victims of Identity Theft Each year?
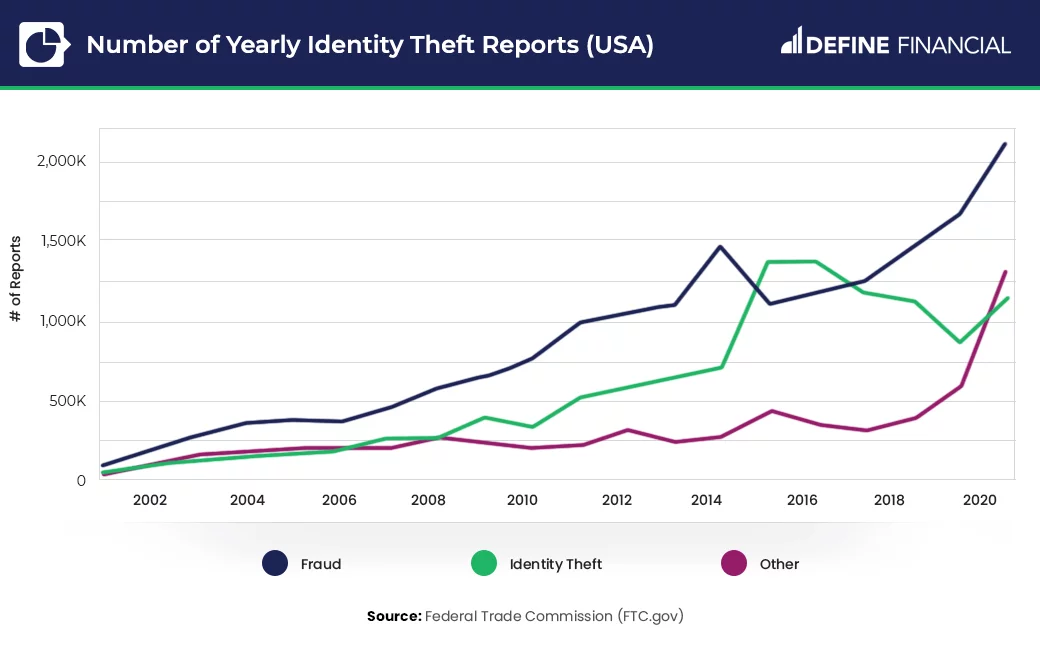
In 2020, there were 1,387,615 cases of identity theft in the US. That’s an increase of 53% over 2019. The following graphic shows the increase in identity theft over the last 20 years.
How Many Identities Are Stolen Each Year? How Many People Get Their Identity Stolen?
The FTC estimates that 9 million identities are stolen each year. Since many people do not report identity theft, no true number of victims exists.
Who Are the Victims of Identity Theft?
According to the Interstate Technology and Regulatory Council (ITRC), the most common victims of Identity Theft are Caucasians (65%), followed by females (63%).
The table below gives a full breakdown:

Identity theft victims tend to be married women across all adult ages, races, education, and income groups.
Victims with college degrees tend to report identity theft more than those with lesser amounts of education.
As to race and ethnic origin, the percentage of White/Non-Hispanic, African American, and Native American victims are higher than their corresponding percentages of the entire US population.
Hispanic and Asian American/Pacific Islanders skew slightly lower than their overall portion of the population.
Identity Theft Reports by Age
2020 was an atypical year for identity theft, in that 30 to 39-year-olds were the most frequently targeted age group for identity theft.
Normally, children under 19, young adults 20 to 29, and seniors over 60 are the most common victims of identity theft.
However, the FTC reports that the most common type of identity theft crime in 2020 was acquiring fraudulent government benefits, such as stimulus payments, PPP loans, unemployment benefits, and EBT/SNAP/food assistance.
This may explain why 30 to 49-year-olds were the most common targets, as they would be seen as “responsible” adults with a need for these benefits due to the pandemic’s economic crisis.
Here’s a chart showing all age groups affected by identity theft in 2020:

How Many People Are Affected by Identity Theft?
The true number of people affected by identity theft is unclear. The National Center for Victim Research reports 7 – 10% of the US adult population are victims of identity theft every year.
Given that married women are the main victims of identity theft, one can assume that their husbands and children are affected, as well.
In fact, 73% of all victims reported to the ITRC difficulties with paying their rent or mortgage, paying utilities, and buying necessities like groceries as a result of the identity theft, which would affect the victim’s entire family.
What Are the Yearly Incomes of Identity Theft Victims?
When it comes to income levels, almost as many victims of identity theft make less than $20,000 a year as those who make over $75,000 annually.
Identity theft strikes those at all income levels. Around ¼ of victims, however, do not include their yearly income as part of their identity theft report. That leaves us with the following details:

America’s Cost of Identity Theft
2020’s increase in identity theft and the rather unique opportunities offered by the pandemic cost American consumers a total of $56 Billion, according to Javelin Strategy and Research.
How much money is lost to identity theft each year?
Individuals reported losses of $3.3 Billion to identity theft or fraud last year. That’s up from $1.8 Billion in 2019. Some estimates though, like that of ID.me CEO Blake Hall, say that as much as $200 – $500 Billion will have been lost in 2020 due to government scammers.
What is the Average Cost of Identity Theft?
Most victims, according to the ITRC, lose less than $500. The FTC reports that the median amount of money lost to identity theft is $800. Unfortunately, 21% of identity victims reported losing more than $20,000 to identity thieves in 2020.
While those younger than 60 are more frequently targeted, those over 60 tend to lose more money to identity theft and fraud. The average loss for those under 60 is $300, while for those over 60, it’s $1,100.
Identity Theft Statistics By State
The FTC ranks states by the number of reports per 100,000 population. So, while California may have the highest number of reports of identity theft by state, Nevada has the highest percentage per capita of its population.
Which States Have The Highest Number Of Identity Theft Reports?
The top ten states for the highest number of identity theft reports in 2020 were:
- Nevada
- Delaware
- Florida
- Maryland
- Georgia
- Virginia
- New Jersey
- Colorado
- New York
- Pennsylvania
Other Identity Theft Statistics
The Most Common Types of Identity Theft
In 2020, the most common types of identity theft were government document or benefit fraud, credit card fraud (specifically opening new accounts), and loan or lease fraud.
The pandemic gave identity thieves a “perfect storm” in which to operate. Computer crime was the fastest-growing type of crime in the world before everyone began working, going to school, shopping for even the basics, and ordering dinner from the corner diner online.
This opened up everyone to even more opportunities for online identity theft attacks.
Much of the government benefit fraud (that became the most common type of identity theft) occurred because government agencies didn’t have time to put secure platforms in place before taking all their business to the internet.
It became easy for fraudsters to get past the hastily created online portals and forms.
How Often Does Identity Theft Occur?
There’s a new victim of identity theft every 2 seconds, according to the Javelin study.
That may seem like too many cases too often, but when you look at the types of identity theft and fraud that commonly occur, it’s easy to see just how often identity theft does occur.
How Many Cases of Credit Card Fraud Were There?
There were 393,207 cases of credit card fraud last year, making it the second-highest form of identity theft. Specifically, most were cases of opening new accounts using the victim’s identity.
How Many Cases of Loan or Lease Fraud Were Reported?
Loan or lease fraud was the third-most-common form of identity theft in 2020, with 204,967 reported cases.
How Many Cases of Phone or Utility Fraud Occurred in 2020?
Phone or other utilities fraud accounted for 99, 539 cases of identity theft last year.
How Many Cases of Bank Fraud Were Committed?
The smallest category of identity theft was bank fraud, with criminals involved in 89, 476 cases of using another’s identity.
Now, let’s take a look at credit card fraud cases from 2020 in some further detail.
Credit Card Fraud Statistics
Just how common is credit card fraud? The FTC reports nearly 400k credit card fraud cases occurred in 2020. Let’s look at some other credit card frauds cases now.
What Is the Most Frequent Cause of Stolen Credit Cards and Card Information Today?
The most common cause of stolen credit cards and credit card information today is eCommerce. So-called “card not present” credit card fraud is on the rise. This is when the card is not needed to make the sale or “steal” the card, only the number. This is most commonly done by hacking into the corporate servers which store the information. The second-most common way credit cards are stolen is through imposter fraud. This is when someone, typically by phone, contacts the cardholder and gains information directly from them by appearing to be a legitimate representative of a company, charity, or bank.
Is Credit Card Fraud On the Rise?
According to Julie Ferguson, CEO of Merchant Risk Council, the pandemic fueled “explosive growth in credit card fraud activity.
Her firm estimates that by the end of 2020, the US saw $11 billion in credit card fraud losses. The US is responsible for one-third of the world’s credit card fraud, and 2020 saw even higher figures than previously.
How Many Credit Cards Are Stolen Each Year?
In 2020 alone, 91,515 cases of “stolen” credit card information occurred, according to the FTC. In-person theft of your credit card is on the decline; however, as we’ve discussed, card-not-present frauds are on the rise.
How Many Credit Card Fraud Reports by Year?
In 2019, the FTC reported over 270,000 reports of credit card fraud. 2020 saw that nearly grow by one-third, to nearly 400,000.
Credit Card Fraud by Age
The largest group of Americans to suffer credit card fraud in 2020 were the seniors, those 60 – 69. As with identity theft, 30 to 39-year-olds came in a close second, with only 7,750, or less than 1%, fewer cases of credit card fraud.

Cybercrime Data Breaches
In any given year, hundreds of millions of Americans are victims of either intentional or accidental data breaches. In fact, hacking into and looting corporate data servers is one of the most common ways criminals obtain your supposedly secure information.
Let’s look now at some data breach statistics by year, including who the most common victims of cybercrime are, where they live, the number of data breaches last year, and the annual cost of cybercrime in 2020.
Number of Data Breaches
There were only 1,108 cases of intentional data breaches last year, according to the ITRC. That is to say, 1,108 times, criminals purposely breached a secure server and stole information from it. This was down from 1,473 in 2019. Diverse agencies such as the US Marshals Service and Amtrak were hacked last year.
Unfortunately, 155.8 million Americans had their data accidentally exposed through less-than-adequate data security in instances such as the faulty security on the Walgreens app and the security lapse at Twitter.
The Cost of Cybercrime
The global cost of cybercrime in 2020 was nearly $1 trillion, according to the Center for Strategic and International Studies. The $945 billion losses are nearly double the $500 billion in 2018.
The Victims of Cybercrime
The LexisNexis Risk Solutions biannual Cybercrime Report listed two age groups as the most vulnerable when it comes to cybercrime — our young adults and our seniors.
Young adults under 25 are the most common victims of cybercrime, possibly due to their new-to-digital naivete. From July to December of 2020, there was a 10% growth of new customers and online accounts in this age group. Seniors over 75 pose the second-highest risk for cybercrime, and they tend to lose the most money to it. They are less familiar with the latest in security technology and are more susceptible to online scams and phishing attempts.
The Number of Cybercrime Complaints
The Internet Crime Complaint Center, or the IC3, reported a total of 791,790 internet fraud complaints in 2020. This was up a whopping 69% from the number of online fraud complaints reported in 2019.
Business email compromise — where an employee has his or her email account hacked into and mimicked — was the most common type of cybercrime last year. Criminals use the email address to request payments or money transfers. Second-highest was confidence and romance scams. Con games and romance frauds are one of the oldest tricks in the book. The criminals build trust and rapport with their victims and then use that to get them to send them money, or personal or financial information. A total of $1.8 billion was lost to business email compromises, while $600.Millions were lost to confidence and romance cons.
Ten States by Number of Cybercrime Victims
The top ten states for cybercrime in 2020 included California, with the most reported cases, and Maryland, with the least. The following chart, compiled with data from the Internet Crime Complaint Center, details the top ten in order of cases reported.

Conclusion
The coronavirus pandemic ensured that 2020 was not going to be a “normal” year, and one of its main side effects was an overall rise across the board in all types of identity theft, credit card fraud, and other cybercrimes.
The world’s sudden need to take nearly every aspect of daily life online, from shopping to schooling to supporting our families, left us a society vulnerable to cybercriminals and their attacks.
The most surprising thing we learned in this report is the staggering amount of money that was potentially lost by government agencies (and the poor victims who never received their benefits) through benefit scams and identity theft.
The second-most surprising fact was that even some of our supposedly most secure agencies and corporations were, in fact, just as vulnerable to either intentional or accidental breaches of secure data as we are. 2020 was far from normal. Let’s hope that data security experts have learned from their mistakes and can grant us a more secure, safer future.