
Today I’m sharing 80+ charitable giving statistics.
In fact, Americans gave a record $471 billion to charities in 2020, according to Giving USA.
This was a 5.1% increase in total giving over 2019. However, adjusted for inflation, it was only 3.8% more than 2019.
Even so, 2020 broke the record for charitable giving despite a global pandemic.
So, who were all these generous Americans? To what charitable causes and non-profit organizations did they give?
We’re going to answer those questions, and more, in today’s look at last year’s charitable giving statistics.
We’ll begin with a broad overview of charitable giving in the US, and then narrow our scope.
Key Takeaways
-
Americans remain highly generous, donating a record $471 billion in 2020, with individuals accounting for over 80% of all giving.
-
Giving habits vary widely by income, age, region, and religion — Baby Boomers and residents of southern states lead the way in total contributions.
-
Online and recurring donations are on the rise, with digital giving up 20% in 2020 and monthly donors giving 42% more than one-time givers.
Charitable Giving Statistics for 2023 (Editor’s Picks)
Here are the top ten statistics we found that stood out from all the reports and studies used in our research:
- Giving in 2020 rose despite the pandemic putting millions out of work,
- Only a fraction (20%) of donations come from corporations
- Those making less than $50,000 a year give more in relation to total income than those in all other income ranges except the highest earners
- Religious giving is lower today than it was during the Great Depression
- Mormons donate more than any other Christian group, while Jewish individuals outdo all other religious givers
- 7 of the nation’s top ten states for charitable giving are in the south
- 2020 saw a huge 20% increase in online giving
- The least likely reason for people to give is so they can get a tax break
- Pfizer was America’s most generous company last year
- Moms aged 35-44 were last year’s top volunteer group
General Charitable Statistics in the US
Over 80% of all donations to charities and nonprofit organizations in the US come from individuals.
According to The Philanthropy Roundtable, this is an international phenomenon. Americans give 7 times more than their European counterparts. Even the stereotypically kind and generous Canadians only give about half as much.
The Philanthropy Roundtable attributes this to three elements somewhat unique in American society and tradition. They are:
- Entrepreneurial spirit. The “American dream” has always been to get ahead and get out from under. Many individuals and companies see it as their duty to give back when they’ve “made it”, helping those less fortunate to get that leg up.
- Social consciousness – From public society benefit organizations like the ACLU to the local food bank, to disaster relief funds, Americans have a tradition stretching back to the earliest days of the country of helping our neighbors.
- Religion – America is still the most religious country in the world, and regular giving to our churches, synagogues, mosques, temples, and other religious organizations is a part of many Americans’ lives.
Let’s look at some other facts on charitable donations by Americans as a whole.
What Percentage of American Households Give to Charity?
Six out of ten (or 60%) of American households participate in some sort of charitable giving, according to The Philanthropy Roundtable.
Did 2020 Break or Follow Trends in Charitable Giving?
2020 continued to follow the trend of increased charitable donations begun in 2010, even with the global COVID-19 pandemic.
Charity Navigator, a charity and non-profit watchdog, reports that Americans have given more every year since 1977, with the exceptions of 1987, 2008, and 2009. So, in that respect, 2020 simply followed the trend of more total giving than the year before.
With All That Religious Tradition, Who Gives the Most?
While Jewish people give the most individually of the three major religions, the diversity of America’s religious makeup makes determining a winner among religious charitable donations by religion difficult to pinpoint.
Jews and Muslims give more to public society benefit organizations involved in civil rights and social inequalities than their Christian and non-Christian neighbors according to a recent study on Islamic philanthropy.
In that same study, we find that amongst Christian groups, Mormons give the most overall. Evangelicals, then Protestants, and then American Catholics do more annual giving to families, children, and human services and causes.
Jews donate money more to non-Jewish organizations than other religions give to groups outside their faiths.
So, to say, who gives the most, or which denomination or religion is the most charitable is nearly impossible since their giving habits are as varied as their beliefs and traditions.
We’ll discuss religious giving in more detail later in this report.
Average Charitable Contributions
The average annual charity donation for Americans in 2020 was $737, according to Giving USA. That figure, however, is a bit misleading. Let’s look at why, using figures from their reports:
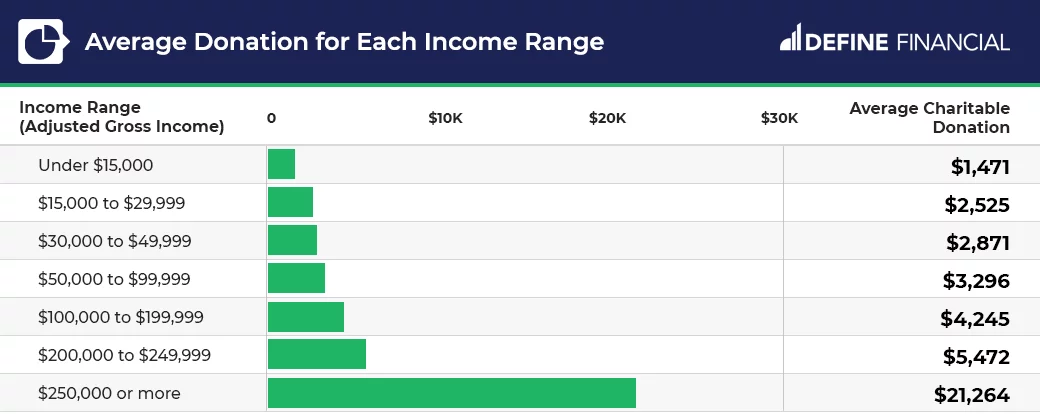
- High net worth families donated, on average, $29,269.
- Among the rest of the general population, that figure was only $2,514
- The average online donation is $177
- Non-profit websites receive an average of $1.13 from each visitor
- Many Americans don’t calculate the monetary value of goods they donate to organizations like Goodwill, the Salvation Army, and local charity groups such as the Humane Society, and human services like food pantries
So while $737 may answer how much the average person gives to charity, average charitable contributions depend greatly on who you are, how much you make, how you are donating, and to whom you are making your donation.
Charitable Giving by Month
December is the most popular month for charitable giving, and both December of 2019 and 2020 were no exceptions to this rule.
Here are some other interesting facts about monthly giving:
- According to Blackbaud Institute, March, April, and May of 2020 saw significant declines in many sectors of charitable giving, as Americans were in the teeth of the pandemic
- Nonprofit Source reports that charities with recurring monthly giving program members receive $52 on average each month
- Donors that set up some sort of recurring monthly donation give 42% more than one-time givers, claims Nonprofit Source
Why Do Charities Ask for $19 a month?
Charities ask for $19 a month for two reasons: human psychology and the IRS.
Psychologists who study why and how we buy have determined that using prices ending in the numbers 4, 7, and 9 are more likely to be successful than prices ending in 0 or 5.
Our brains perceive the 4, 7, and 9 prices to be cheaper and more affordable than other numbers. We see $19 as easier on our wallets than $20. As such, we’re more apt to be willing to give that amount each month.
The IRS requires charities and nonprofits to give donors receipts for annual donations totaling $250 or more. Asking for $19 monthly adds up to only $228 a year. This saves them from the cost and time needed to mail receipts to their many donors.
Charitable Giving Demographics
Let’s examine just who some of those many donors are.
What Age Group Gives the Most to Charities?
The average age of the US donor is 64, putting them firmly in the Baby Boomer generation.
Where Do the Most Charitable People Live?
The most giving people in the US live in Utah according to The Philanthropy Roundtable and the IRS. More than half of the top ten states for total giving, however, are in the South.
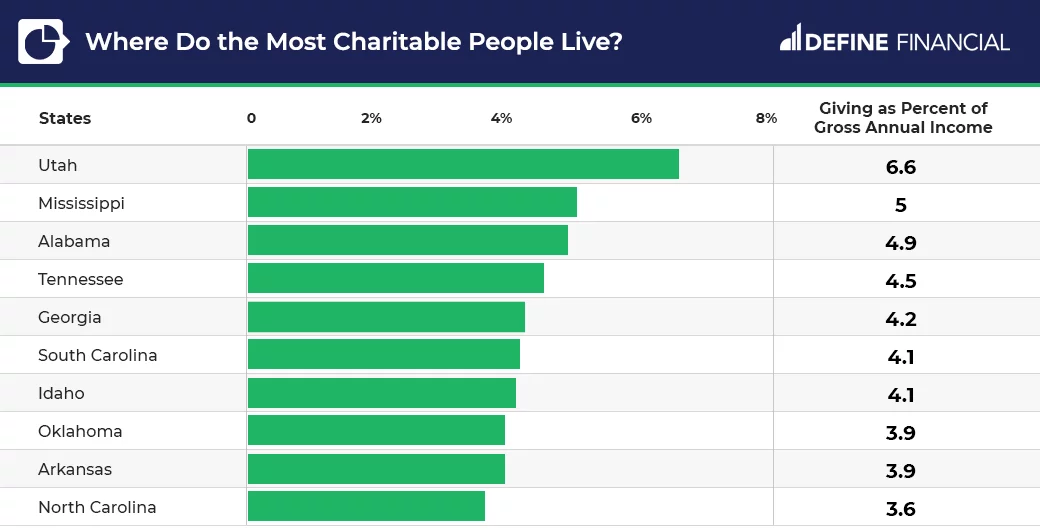
These figures aren’t that surprising when you remember that Mormons and Evangelical Christians are some of the country’s biggest donors.
Why People Give to Charity
There are seven proven reasons why people give to charities. In order, they are:
- Scientific studies have proven that giving releases the “feel-good” chemical dopamine in the brain, so giving makes us happy.
- Donors feel empowered when they see their gifts actually doing the good the charity says they will.
- They have a personal or emotional connection to a cause.
- The charity or nonprofit is one that donors can trust. The work actually gets done, a change is actually made, and they see it.
- They want to be a part of something bigger than themselves. Be it animal welfare, medical research, or foundations for the arts, culture, and humanities, donors feel as if they belong to a larger community and are making a difference.
- The charity has caught their attention. Perhaps they’ve seen advertising for fundraising events in the community, or through Facebook fundraising tools, or heard about the charity through social media posts. The charity comes to their attention and they give.
- Tax purposes. It’s not only corporations and wealthy households that donate money just for tax breaks. About one-third of all tax deductions for charitable donations are taken by those making $50,000 or less each year.
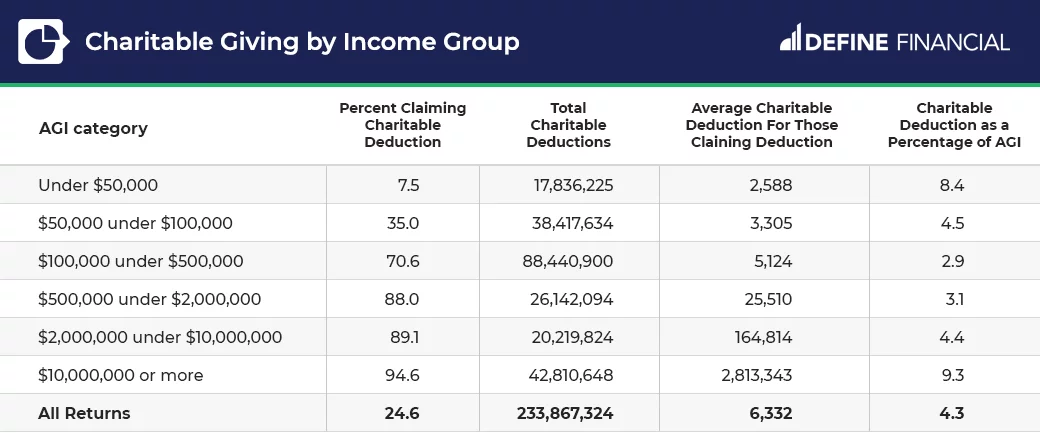
Charitable Giving by Income Group
The chart below, from the Tax Policy Center, shows us two surprising things:
- Those making less than $50,000 annually are the second-highest givers in terms of percentage of income
- Those making between $100,000 and $500,000 are least in total charitable giving in relation to gross income.
What is the Average Donation for Each Income Range?
Average giving varies greatly among income brackets, so it’s best to express the data visually in a chart, with charity statistics gathered by the IRS.
Charitable Giving by Age Group
Now, let’s look at how each generation gives, how much they give, and where their charitable dollars go. We’ll start with Millennials and work our way up to the senior seniors of the Silent Generation.
How Much Do Millennials Give to Charity?
Millennials give $481 to charity annually. 84% of millennials give to charity and nonprofits.
The average charity or nonprofit will have Millennials making up 5 to 10% of its donors. Millennials prefer to donate money through online platforms. They like setting up recurring donations. Over 40% who give do so with a monthly deduction to their credit or debit card.
Millennials are also the most likely to use their mobile devices — their phones, tablets, and laptops — to research charities, donate money, and advocate for their latest cause.
Millennials tend to support the following charities:
- Children’s charities
- Health and medical nonprofits
- Local places of worship
- Human rights and international affairs groups
How Much Does Gen X Give to Charity?
The average Gen X donation totals $732, with 59% of Generation X being regular donors.
While there are fewer Gen X donations than their younger Millennial counterparts, Gen Xers are more likely to start fundraising campaigns, as well as more likely to volunteer their time and efforts to worthy causes.
And while Millennials are most often influenced by social media posts and online donations, Gen Xers report that email is the most influential method of reaching them.
Gen Xers give to the following:
- Local social and human services organizations
- Animal organizations
- Children’s charities
- Local places of worship
How Much Do Baby Boomers Donate to Charity?
Baby Boomers are quite generous, with a total giving of an average of $1,212 per person per year. That’s nearly three-fourths – 72% – of the entire Baby Boomer Generation, accounting for 43% of all donations made each year.
The Baby Boomers are the old hippies of the 1960s, and many who were activists then are still supporting causes today. While their long hair may be thinning and even gone, their love of social justice, world peace, and environmental issues is still going strong.
This may explain why Baby Boomers’ donations are the biggest supporters of:
- Local social services nonprofits
- Animal organizations
- Children’s charities
- Human rights and international affairs
- Local places of worship
How Much Does the Silent Generation Give to Charity?
The Silent Generation – those born between 1927 and 1946 – give an average of $1,367 annually per person. 88% of them are donors.
While they make up only 11% of the US population, they account for 26% of all giving. And they have slightly different giving habits. They prefer to give to organizations that reach them via direct mail and to causes that they see in the news.
Silent Generation donations support:
- Veterans’ causes
- Local social services
- Emergency and disaster relief fundraising events and efforts
- Local places of worship
The Four Generations and 2020 Giving
Of the 12 sub-sectors of nonprofit organizations used for most nonprofit fundraising statistics, only two saw significant donation growth last year. The pandemic increased giving to local human and social services organizations by 12%, and faith-based giving grew by 3%.
The biggest “losers” among American charities last year were medical researchers and arts and culture subsectors.
Medical researchers may have suffered because with the government’s investing in COVID-19 research, donors may have not felt the need. Another possibility is that COVID-19’s domination of the health news may have caused donors to overlook other medical causes.
And with all the COVID-19 restrictions, many arts, culture, and humanities groups simply could not perform, eliminating their ability to raise funds.
Religious & Church Charitable Giving Statistics
All four major donor generations give to local places of worship. Let’s look at religious giving more closely.
Most Charitable Giving by Religion
Jewish people give the most of all the religious faithful, averaging $2,526 annually, to Protestants’ $1,749, Muslims’ $1,178, and Catholics’ $1,142.
Jewish and Muslim donors tend to prefer to donate money to social and human rights organizations, while Christian giving choices vary by denomination. That said, 32% of all donations made in the US are to a local place of worship or a faith-based nonprofit.
How Much Does the Average Family Give to Their Local Place of Worship?
The average American gives $17 weekly to their local place of worship. However, 37% of the weekly “faithful” don’t give anything at all. According to NonProfit Source, only 5% of congregants give regularly.
The average weekly church donation per person is dropping. The average weekly church donation is down nearly 1% from the Great Depression. Christians during the 1930s gave 3.3% of their total income. Today’s faithful have dropped that to 2.5%.
Interestingly enough, 75% of non-religious, non-affiliated Americans give to charities, many of them faith-based organizations.
How Much Do Religious Organizations Give to Charity?
There’s no way of knowing what percent of revenue religious organizations give back. The IRS does not require religious organizations to report on what they give. What we know of religious giving comes from data collected by the IRS on 128 million faithful givers.
A recent study by The Philanthropy Roundtable found that 57% of all the “good works” being done in American communities have no affiliation with or participation by religious groups at all.
Charity is moving from religious hands to secular ones.
How Much Money Do Religious Organizations Make Annually?
Religious organizations receive around one-third of all monetary donations annually. In 2020, this came out to $128.17 billion. This data came from a survey of millions of IRS tax returns.
And while religious giving has remained steady at right around the 30% mark for several years now, future trends may not hold. Religious affiliation and regular attendance are dropping, with just 36% of American adults claiming weekly worship.
Volunteer Fundraising Statistics, Facts & Trends
We’ve already established that Baby Boomers are typically the most active volunteers. Let’s look at some other facts surrounding volunteering.
How Many People Volunteer in the US?
77.34 million adults volunteered over 1.6 billion hours, claims Americorps’ Volunteering in America report. That’s 30% of the adult population.
How Many Hours Do Americans Volunteer Each Week?
The average volunteer hours per week of American volunteers is 3.5 hours, according to Americorps, for an estimated total of $255 billion in unpaid labor and services.
US Volunteerism Trends
There are three trends in US volunteerism: volunteers are getting younger, female, and better educated.
More volunteers looked like this in 2020 than ever before:
- Married
- Female
- Aged 35-44
- White
- Some sort of higher/secondary education
- With children under 18
This trend may not hold, however, as the pandemic may have had a greater impact on volunteering than other factors. It was the country’s working mothers, after all, who had to switch to working from home so they could be there for their children once schools closed.
They may have decided to use whatever “non-lockdown” time they had available to fill some needs in their communities, and simply as a way of getting out of the house.
There were also reports by the older volunteer generations that they would not be volunteering as much due to health concerns brought on by COVID-19.
Volunteer Fundraising Demographics: What Age Group Volunteers the Most?
We’ve noted that in general, the Baby Boomer generation volunteers the most overall, but in 2020, the younger Gen X and older Millennial moms took the crown away.

Corporate Giving Statistics
Let’s look at what businesses gave last year.
Average Corporate Giving in the United States
Corporate donations to nonprofits totaled $24.8 billion in 2020, a decrease of 6%, according to Giving USA’s report.
Corporate giving is closely tied to pre-tax profits, while individual giving is more closely tied to the stock market. The stock market was up last year, while many corporations saw profits decline due to the pandemic.
Who Are America’s Most Charitable Organizations?
Pfizer was America’s most charitable corporation in 2020, as reported by the Chronicle of Philanthropy. Rounding out the top five most charitable organizations in the US are:
#5: Google
#4: Walmart
#3: Merck and Company
#2: Gilead Sciences
#1: Pfizer
Corporate Giving to Religious Organizations
Kroger is listed as Double the Donation Organization’s best corporation for giving to churches and other religious organizations. They give millions in money and products to hunger relief, homeless relief, and other programs run by local religious organizations.

School Fundraising Statistics
In 2020, school fundraising fell 4.6% for K-12 schools according to Giving USA. Schools normally take in around $5000 per school each year. The pandemic’s closing of the schools likely caused the decline.
Online Giving Trends
Online revenue from online giving grew 20% in 2020 — likely due to the pandemic.
Online Fundraising Statistics
It’s no surprise that online giving grew last year. We did everything online last year – working, schooling, shopping, ordering dinner, ordering drinks, keeping in touch – so naturally, we gave online last year, too. Let’s examine our online giving in more detail.
Online Charitable Giving Growth by Year
Every sector saw at least a 15% increase over previous years as the charitable giving growth rate increased by 20%.
Giving Tuesday Statistics
Giving Tuesday matching funds have grown every year since 2012, with $380 million raised last year.
What Is Giving Tuesday?
Giving Tuesday is the first Tuesday after the Thanksgiving holiday.
When Did Giving Tuesday Start?
Giving Tuesday started in 2012, by the United Nations Foundation in New York City.
Online Crowdfunding Statistics
The Most Successful Crowdfunding Nonprofit Campaigns
Two of the most successful nonprofit crowdfunding campaigns have been operated by Save the Children and the American Red Cross, raising $20 million and $4.7 million respectively.
Crowdfunding stats for nonprofits show that crowdfunding success rates largely depend on four things:
- Social media sharing – the rate of success rises with every social media contact – 10 friends increase 9%, 100 friends increase success by 20%, etc.
- Campaign descriptions of 300 to 500 words
- Regular updates for supporters – updates every 5 days result in 3X more donations
- Videos – campaigns with video appeals raise 150% more than those without
How Many Nonprofits Are There in the World?
There are 1.54 million nonprofits registered with the IRS, as listed by the National Center for Charitable Statistics, so if all this talk of donating has you dying to help, you’ve got plenty of causes to choose from.
Conclusion
If in a year of such uncertainty and chaos as 2020, we can continue to give, and to give more than ever before, there’s no doubt American’s generosity knows no bounds, gaining strength even amongst great adversity, social unrest, and political divisiveness.
That, we believe, is the most surprising thing about this report. And yet, perhaps it isn’t. This is America, after all.

Taylor Schulte, CFP® is the founder & CEO of Define Financial, a fee-only wealth management firm in San Diego, CA specializing in retirement planning for people over age 50. Schulte is a regular contributor to Kiplinger and his commentary is regularly featured in publications such as The Wall Street Journal, CNBC, Forbes, Bloomberg, and the San Diego Business Journal.